
Network monitoring and RMM Every site, ship and device on one screen.
Azimuth is a network operations centre for businesses, IT teams and fleets. It watches your networks, servers, computers and websites, tells you what broke and why, and lets you fix it before anyone calls.
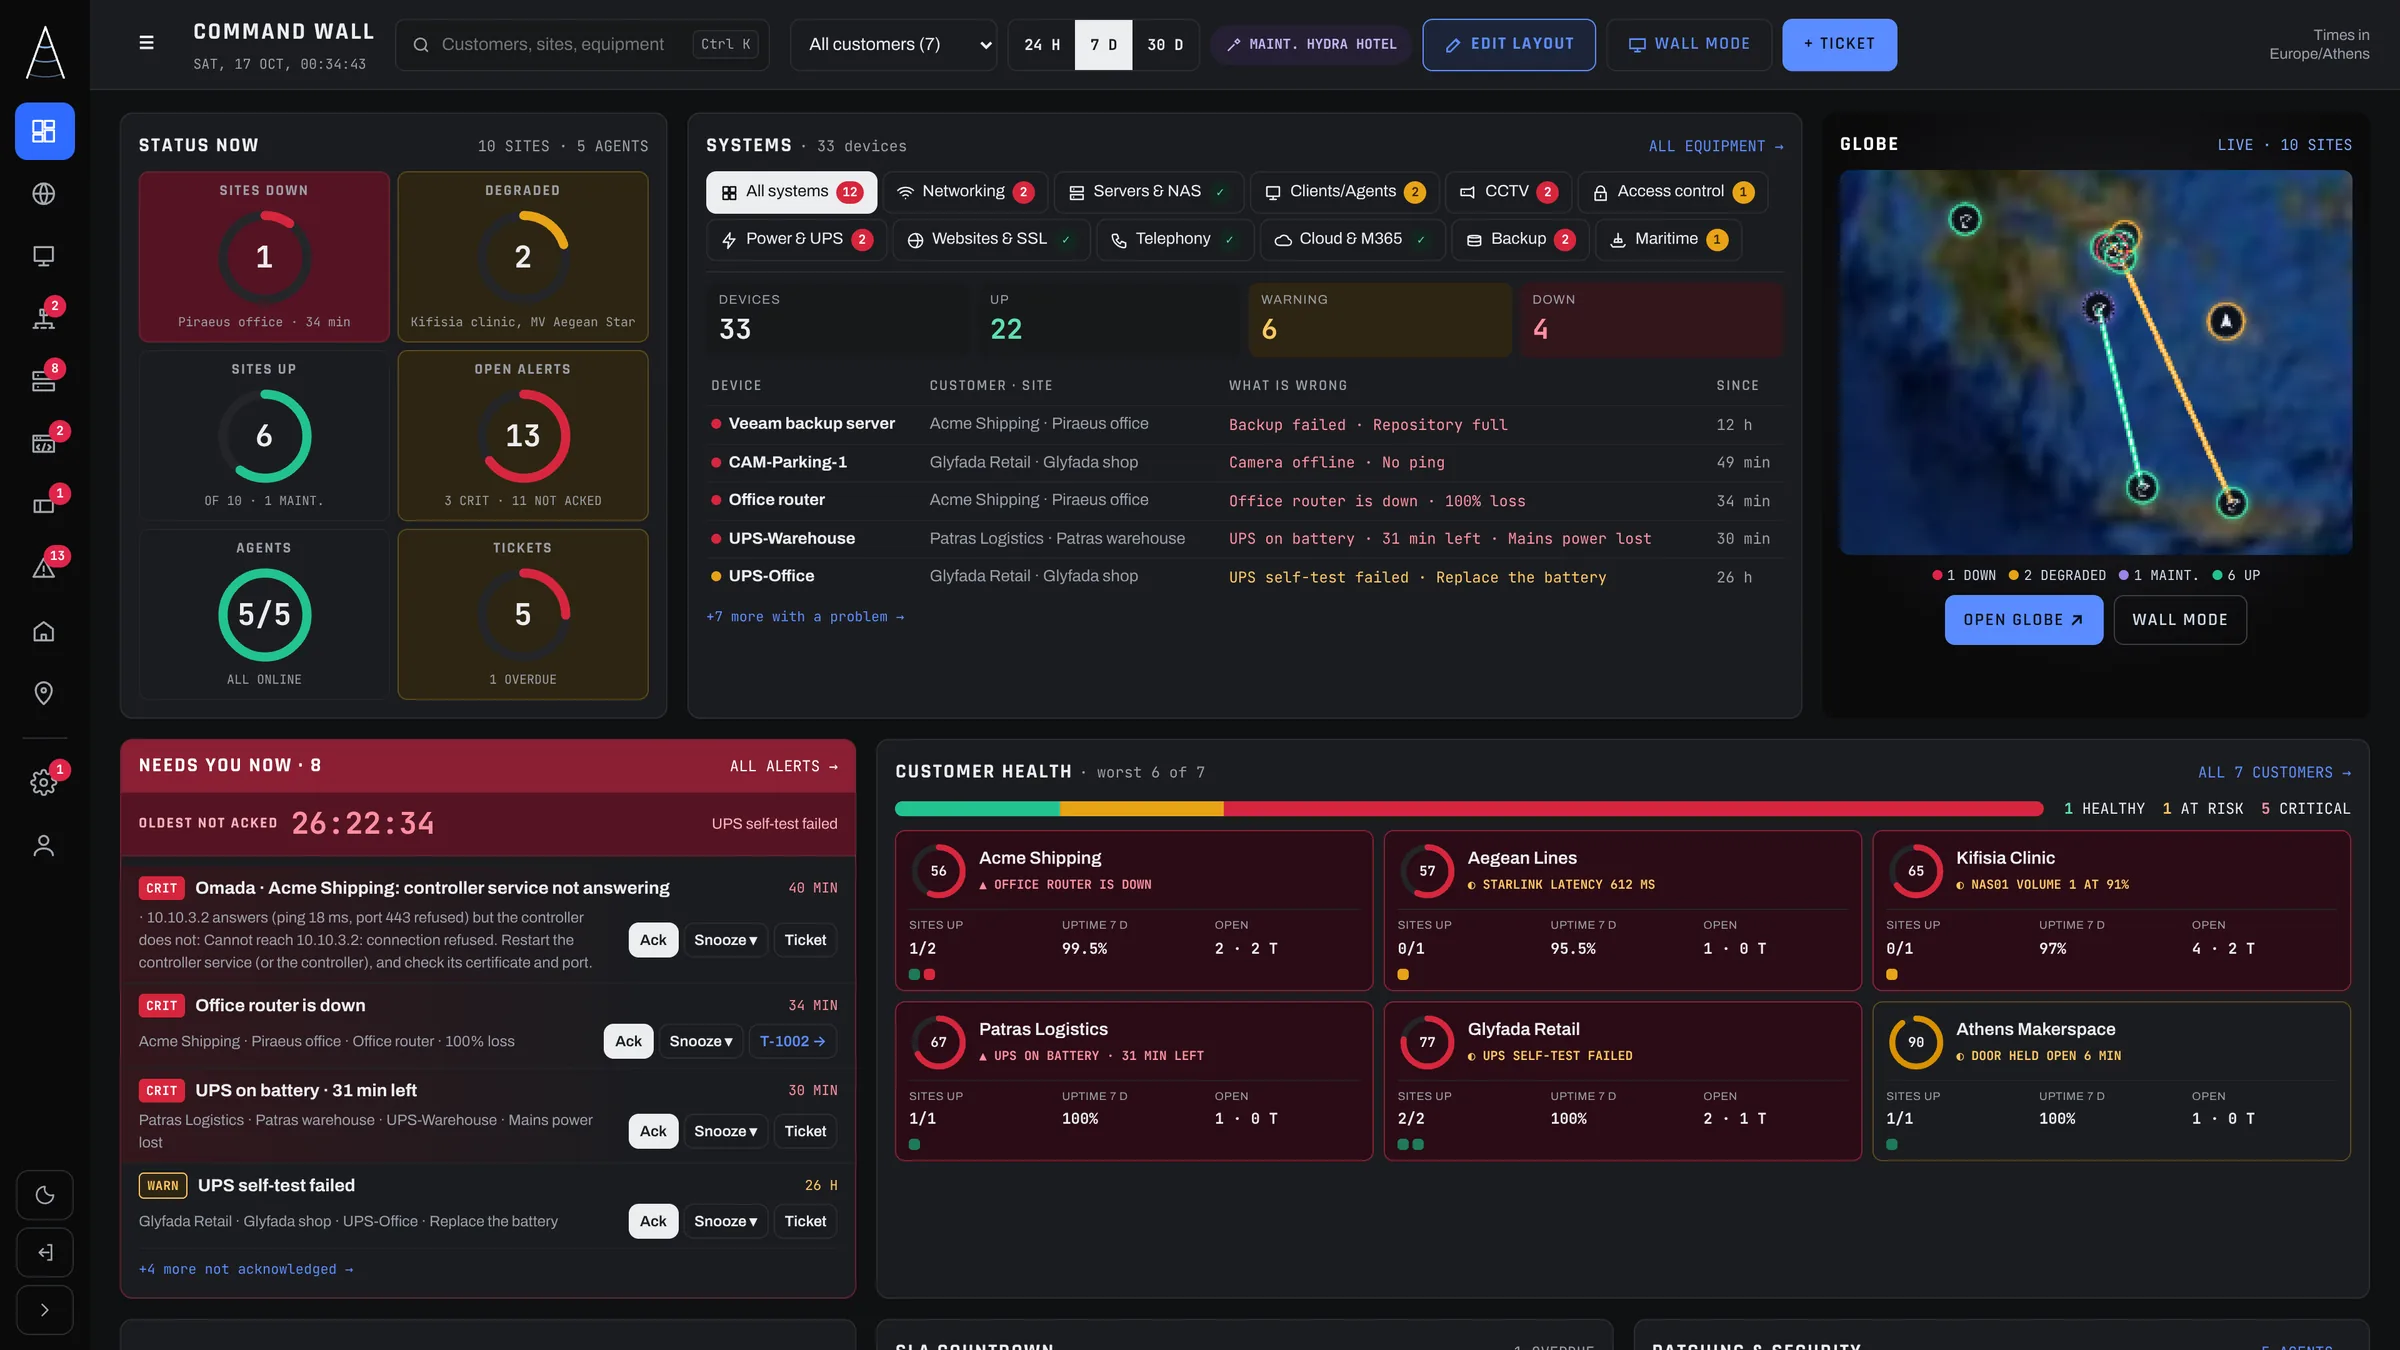
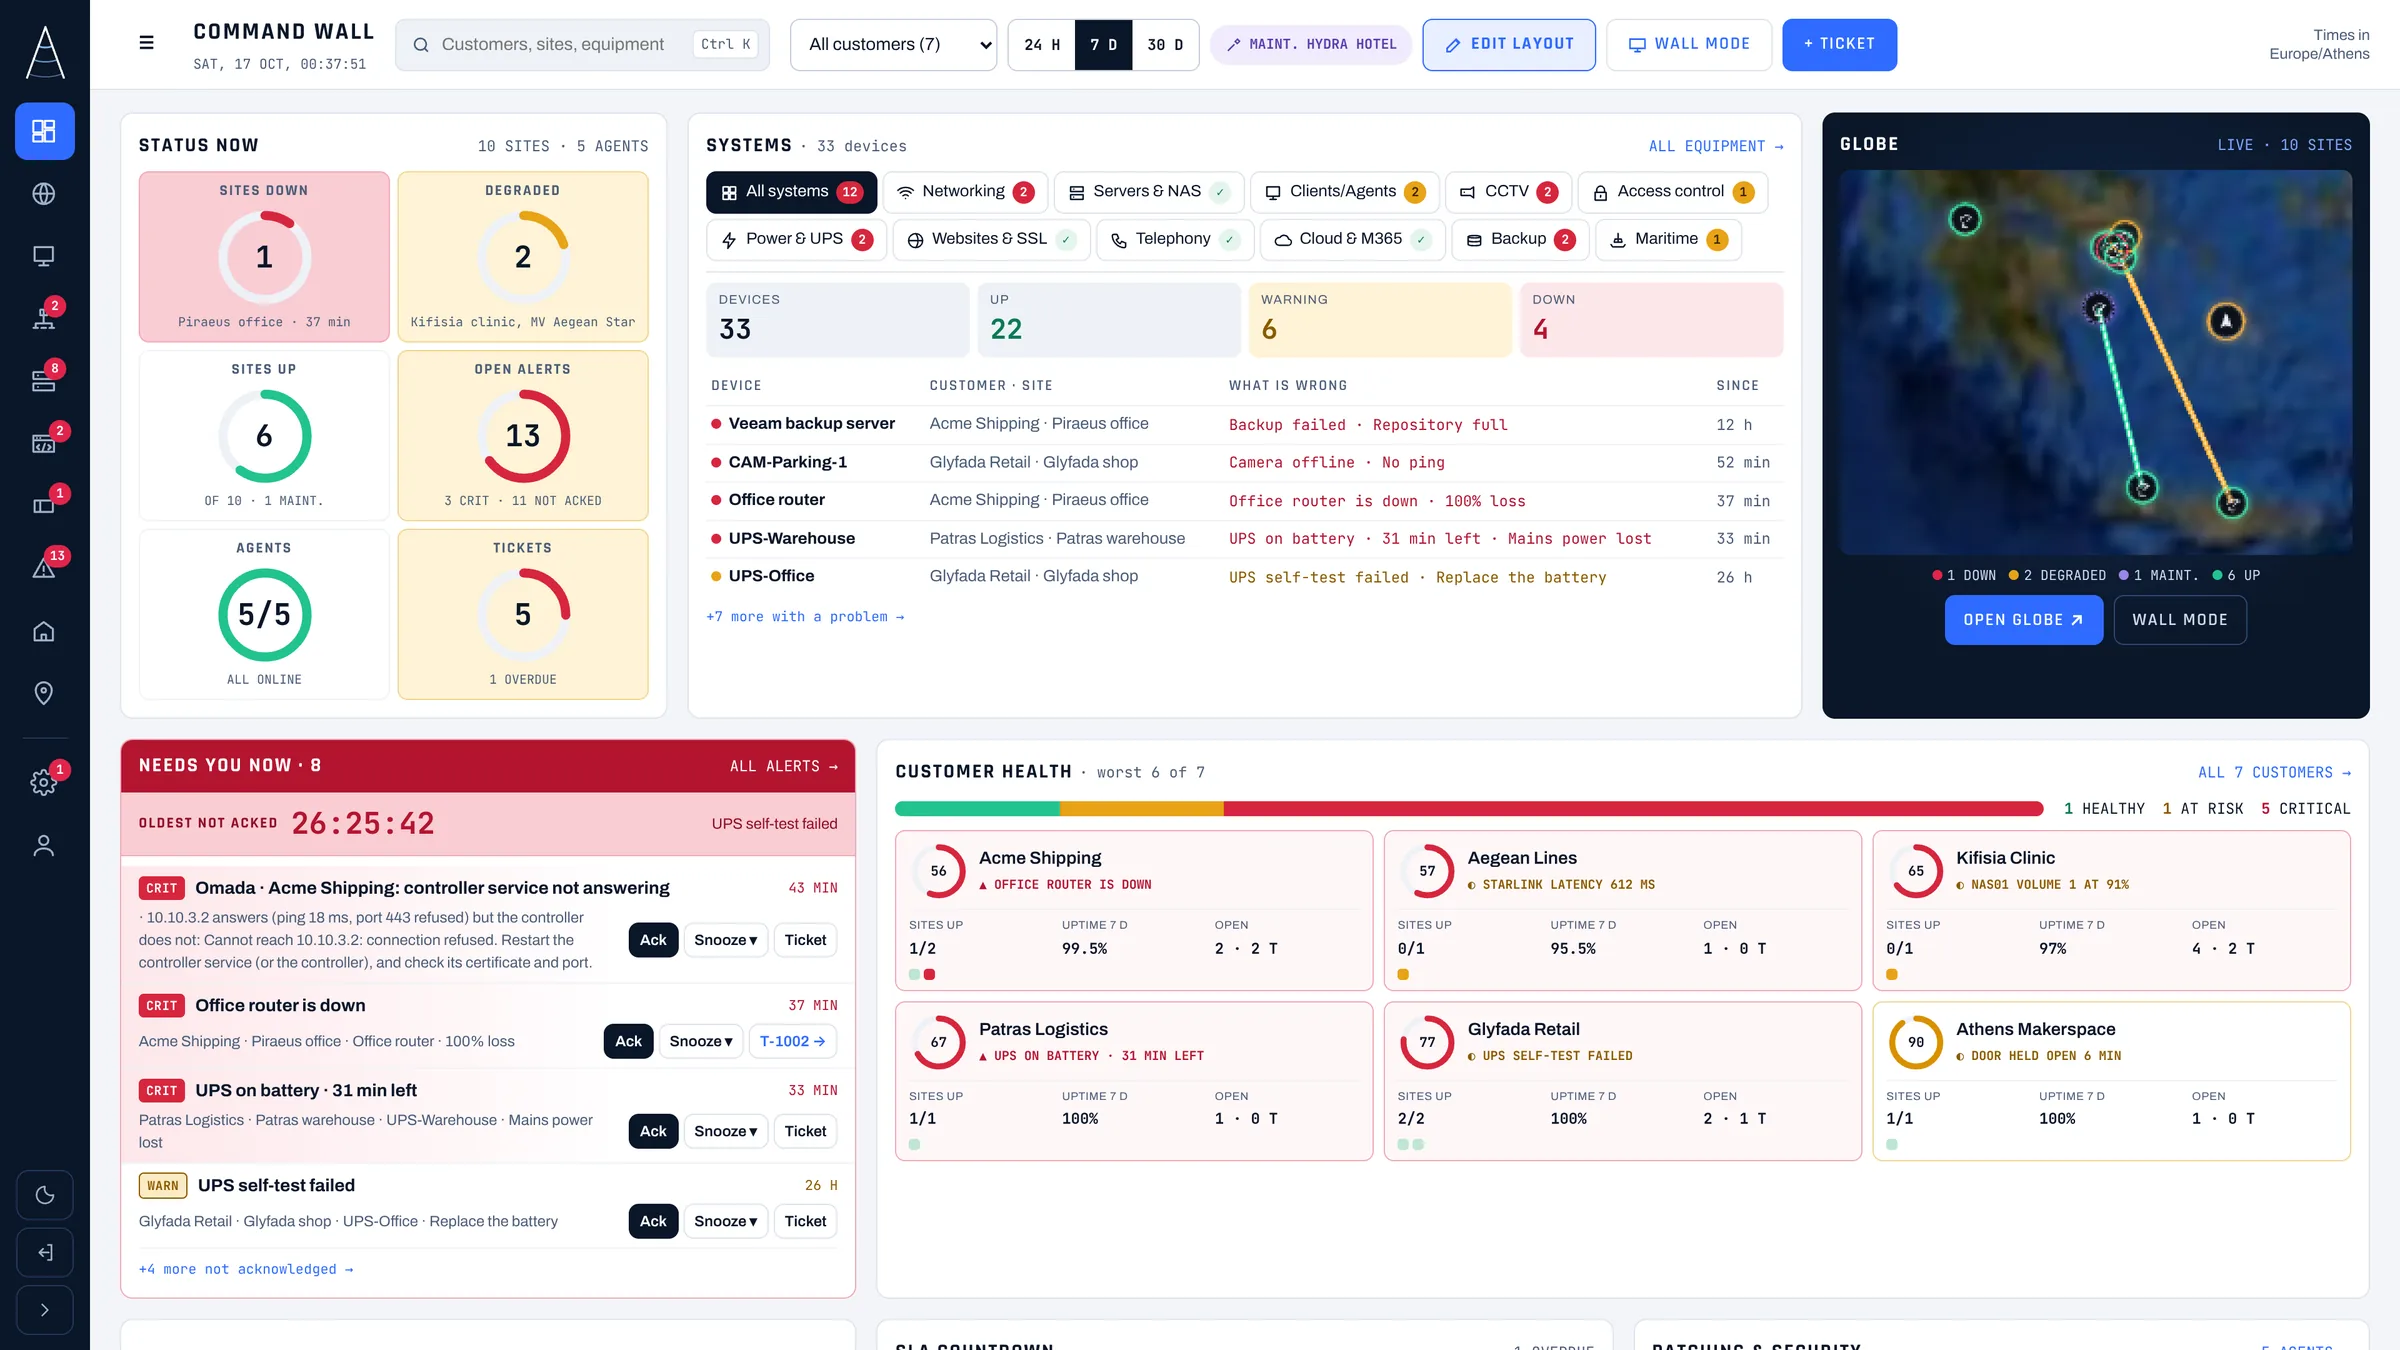
- Press play to watch Azimuth detect, diagnose and resolve an outage.
From orbit
This is what Azimuth watches.
Offices, shops, hotels, clinics and ships, wherever they are. Every router, switch, access point, server, PC and website, checked every minute, day and night.
- 7 monitoring areas
- One console for all of them
- Alerts on screen, by e-mail and by Telegram
Over the Aegean
Every site, linked.
Each site connects to Azimuth over its own encrypted WireGuard tunnel, started from inside the site. Every link is measured for latency, loss and jitter against its own limits.
- Green: inside its limits
- Amber: degraded or a warning
- Blue: in a maintenance window
At sea
Every ship, at sea.
A vessel is a site with a satellite link. Its Starlink connection is measured like any other, its bridge PCs and onboard network report through the same agent, and it sits on the same screen as your offices.
- Starlink latency and uptime
- Warning, not critical, on backup
- No open ports on board
Back on the ground
All of it, on one screen.
See your own sites and ships on Azimuth. We'll set up a demo with your kind of equipment and send you a quote, priced per device.
- 0
- open ports
- 60 s
- between checks
- EU
- data in Germany
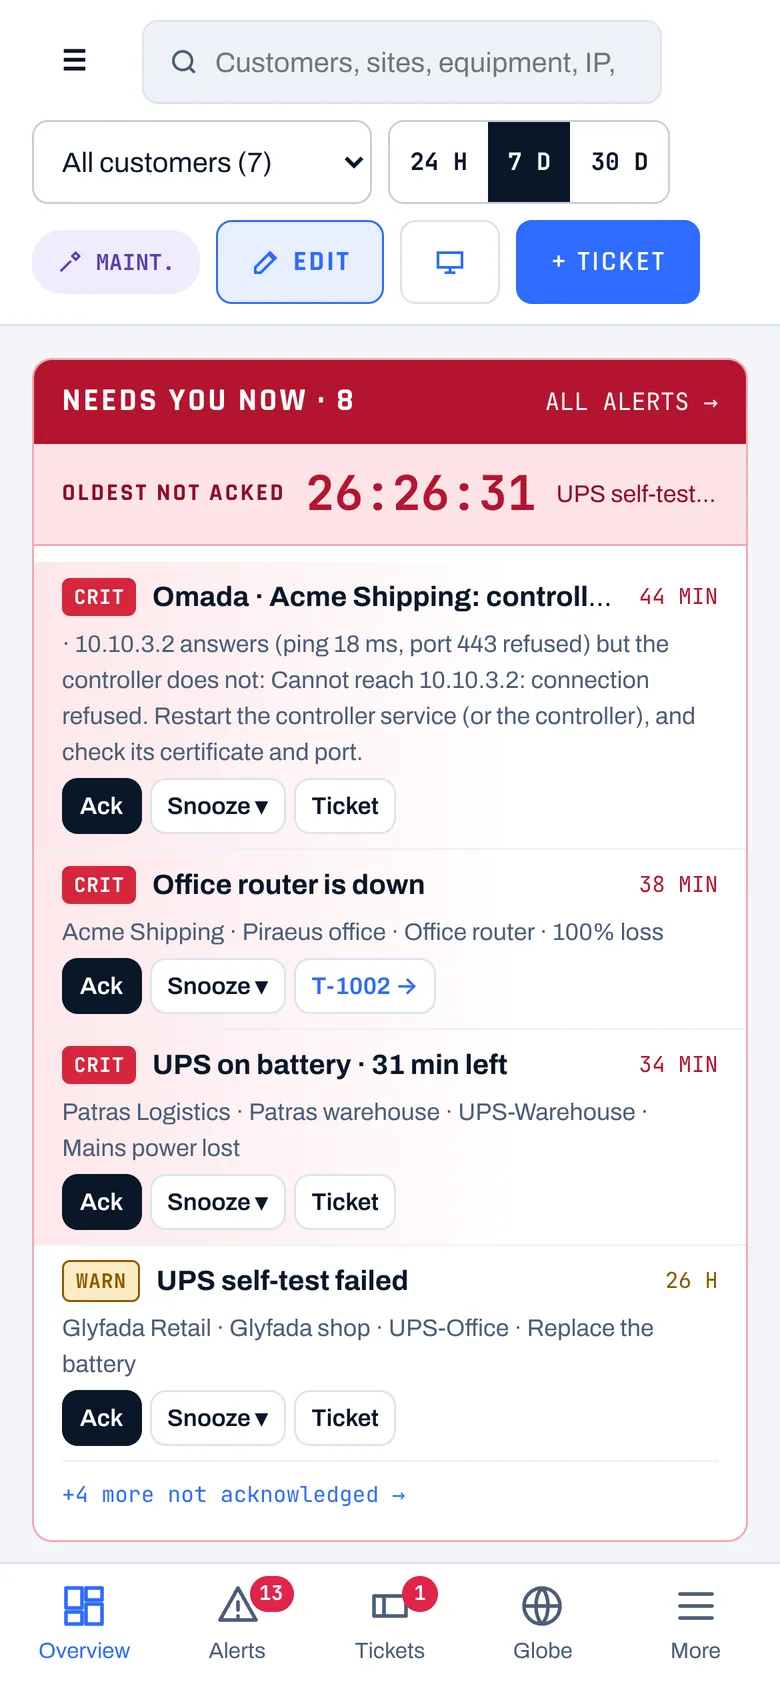
The first screen tells you what needs you.
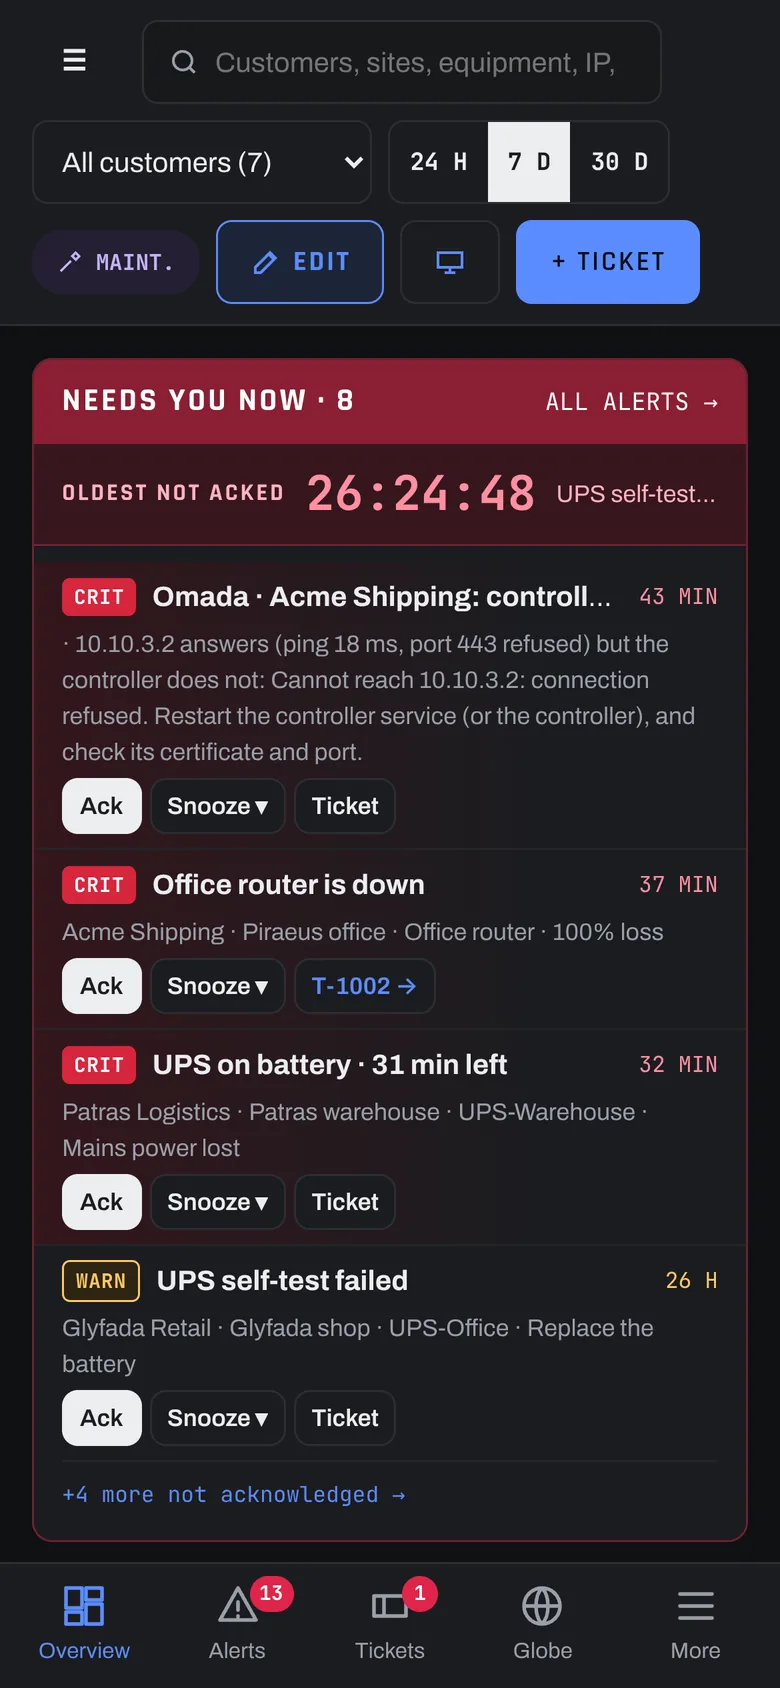
The Overview puts problems first, then every customer, system and risk. Acknowledge, snooze or open a ticket in one click. This is the real Azimuth console, shown with example data.
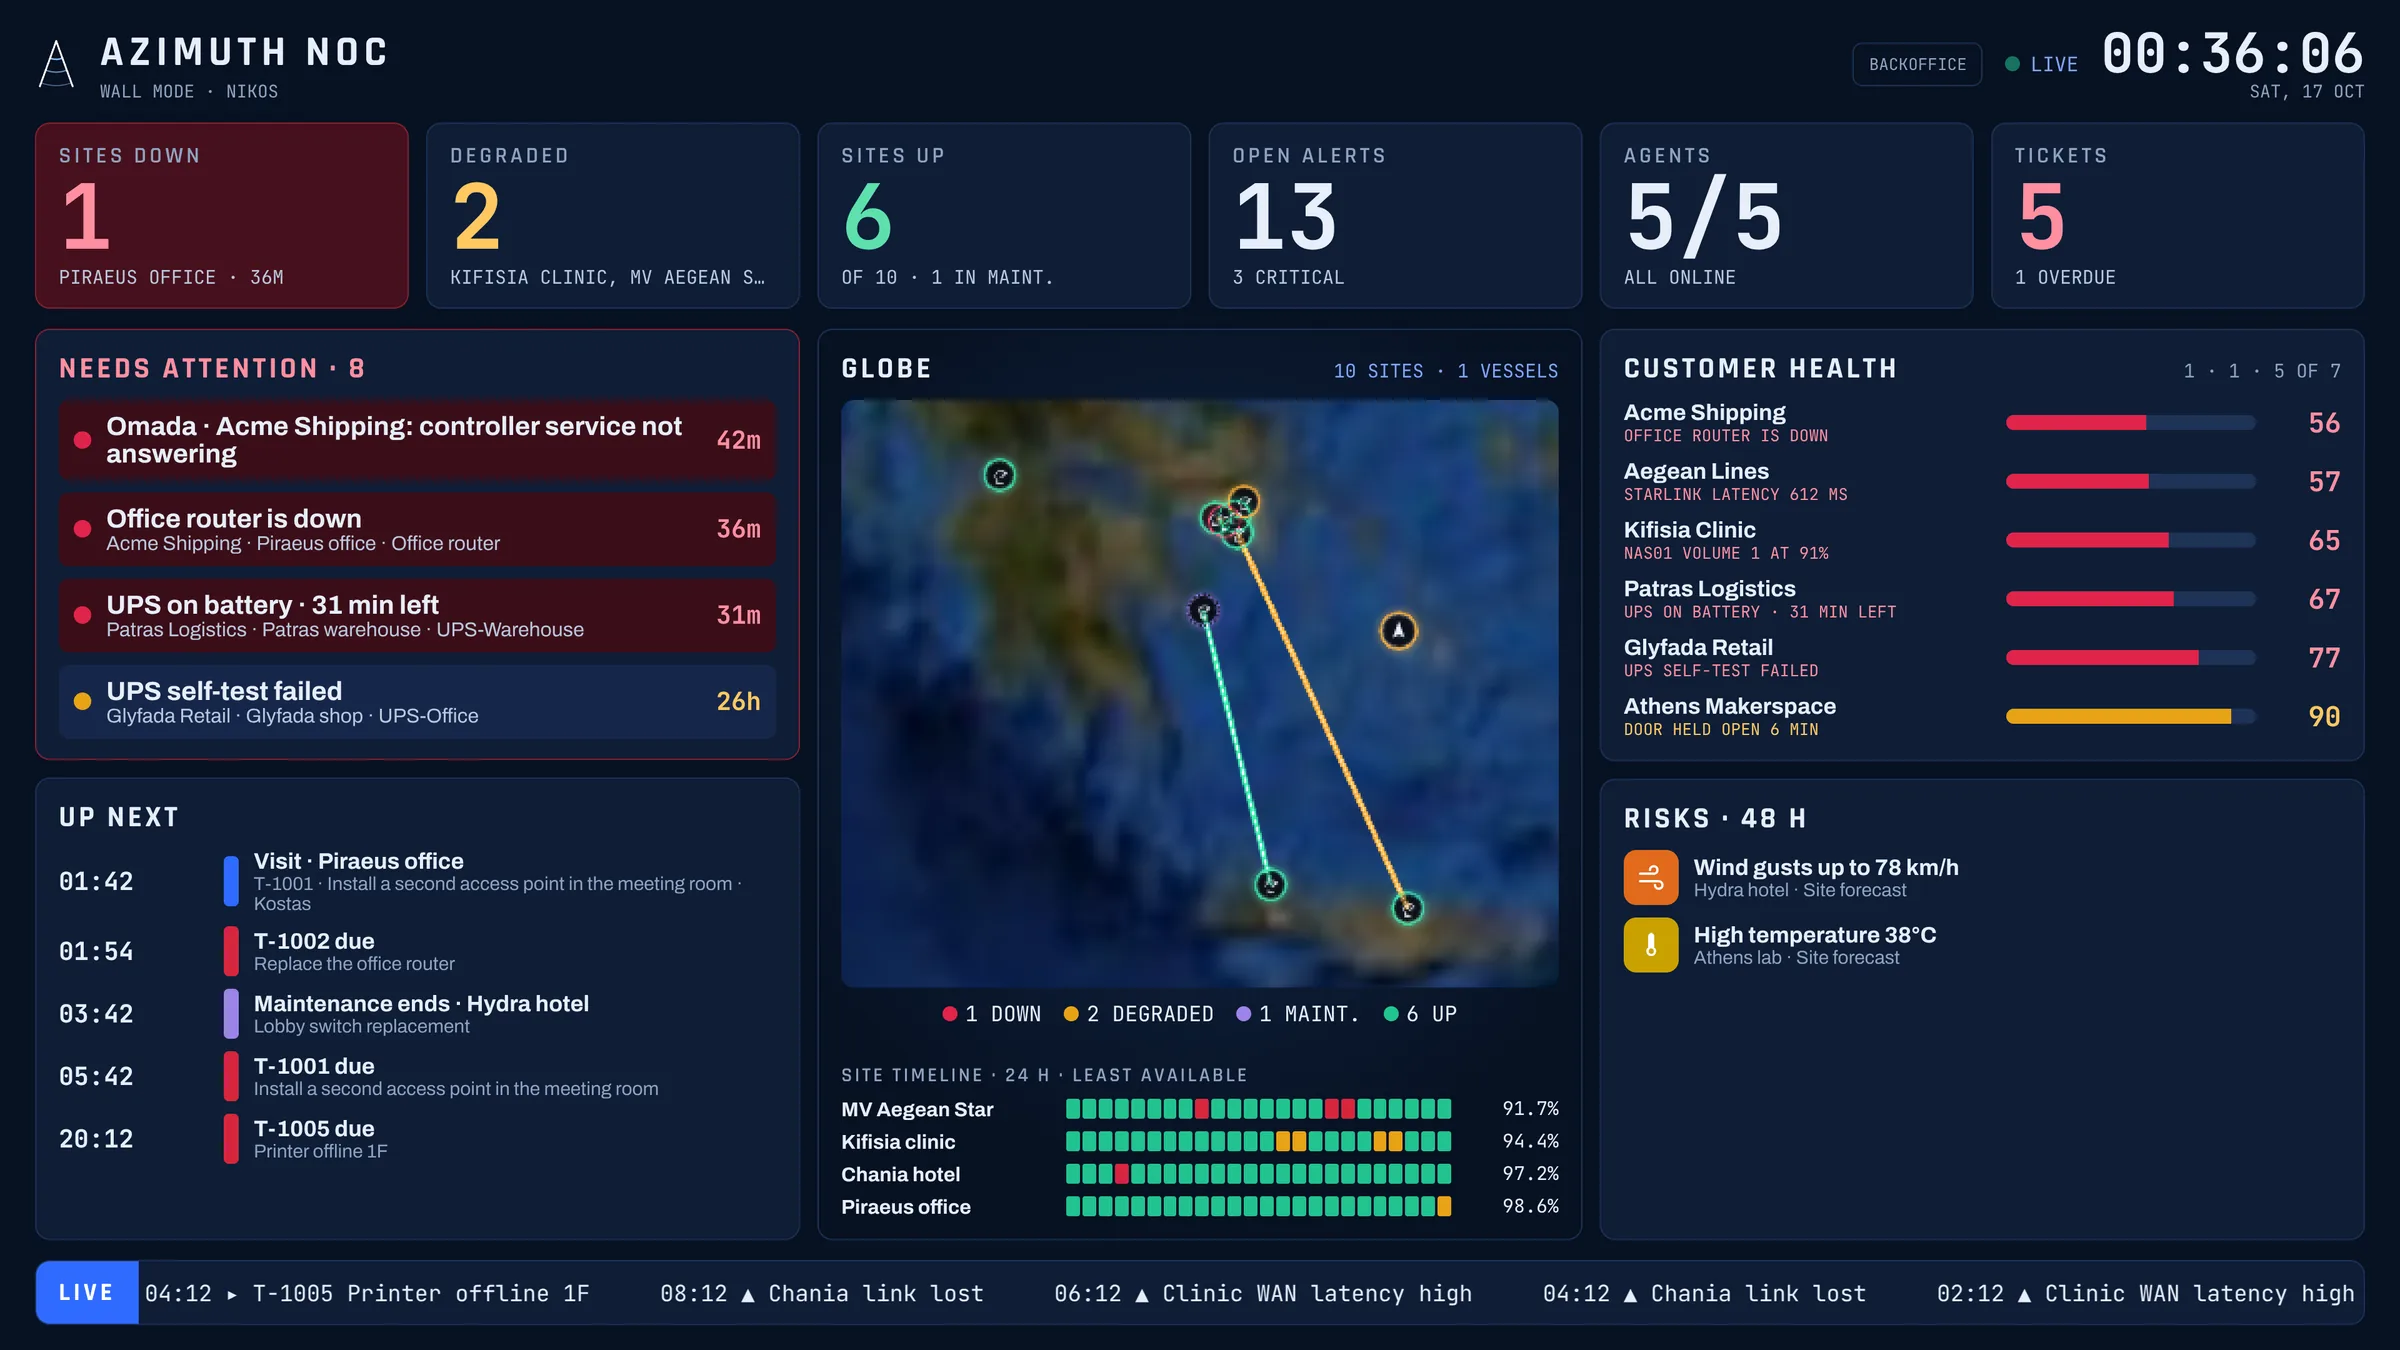
Sites down, degraded and up, alerts, agents and tickets, readable from across the room.
Networking, servers, CCTV, power and more, each with its own problem count.
Technicians get their day, alerts and tickets with buttons sized for thumbs.
Detect. Diagnose. Resolve.
The three things a NOC is for, in the order they happen.
Detect
Networks, servers, computers, websites and site links are checked all the time, and every problem lands on one screen.
- Omada and UniFi read directly, no cloud
- One agent for Windows, Linux, Synology, TrueNAS
- Latency, loss and jitter on every link
Diagnose
Azimuth says why, not just what. A quiet controller, a stale agent and a flapping link each read differently.
- Site down, software stopped or login refused
- Grey when data is old, never a false green
- One message for a flapping link, not a storm
Resolve
Fix it from the same screen. Every action is confirmed and logged, and nothing is retired without a person deciding.
- Reboot, patch, run approved scripts
- Self-hosted remote desktop in one click
- Tickets with SLA countdowns
One platform for everything you look after.
Seven areas in one console, with the same alerts, the same tickets and the same globe.
Network
Switches, routers, access points and gateways.
Servers & computers
Windows, Linux, Synology and TrueNAS.
Telephony Coming soon
IP phone systems and desk phones.
Websites & services
Uptime, speed, certificates and domains.
Software & subscriptions
Updates, antivirus and paid licences.
Site-to-site links
VPNs, wireless bridges, fibre and leased lines.
Inventory & topology
Every piece of equipment and how it connects.
Ships
Onboard systems and satellite links.
All features
Everything Azimuth does, on one page.
Build your estate.
Pick a starting point or set your own numbers. Your sites, ships and devices appear on the map as you go, and one click turns it into a quote request.
Azimuth Edge. One box per site.
Plug it into the site network and it watches everything on that network. It opens its own encrypted tunnel to Azimuth, so there is nothing to set up on the firewall. The same box goes into an office, a factory or a ship.
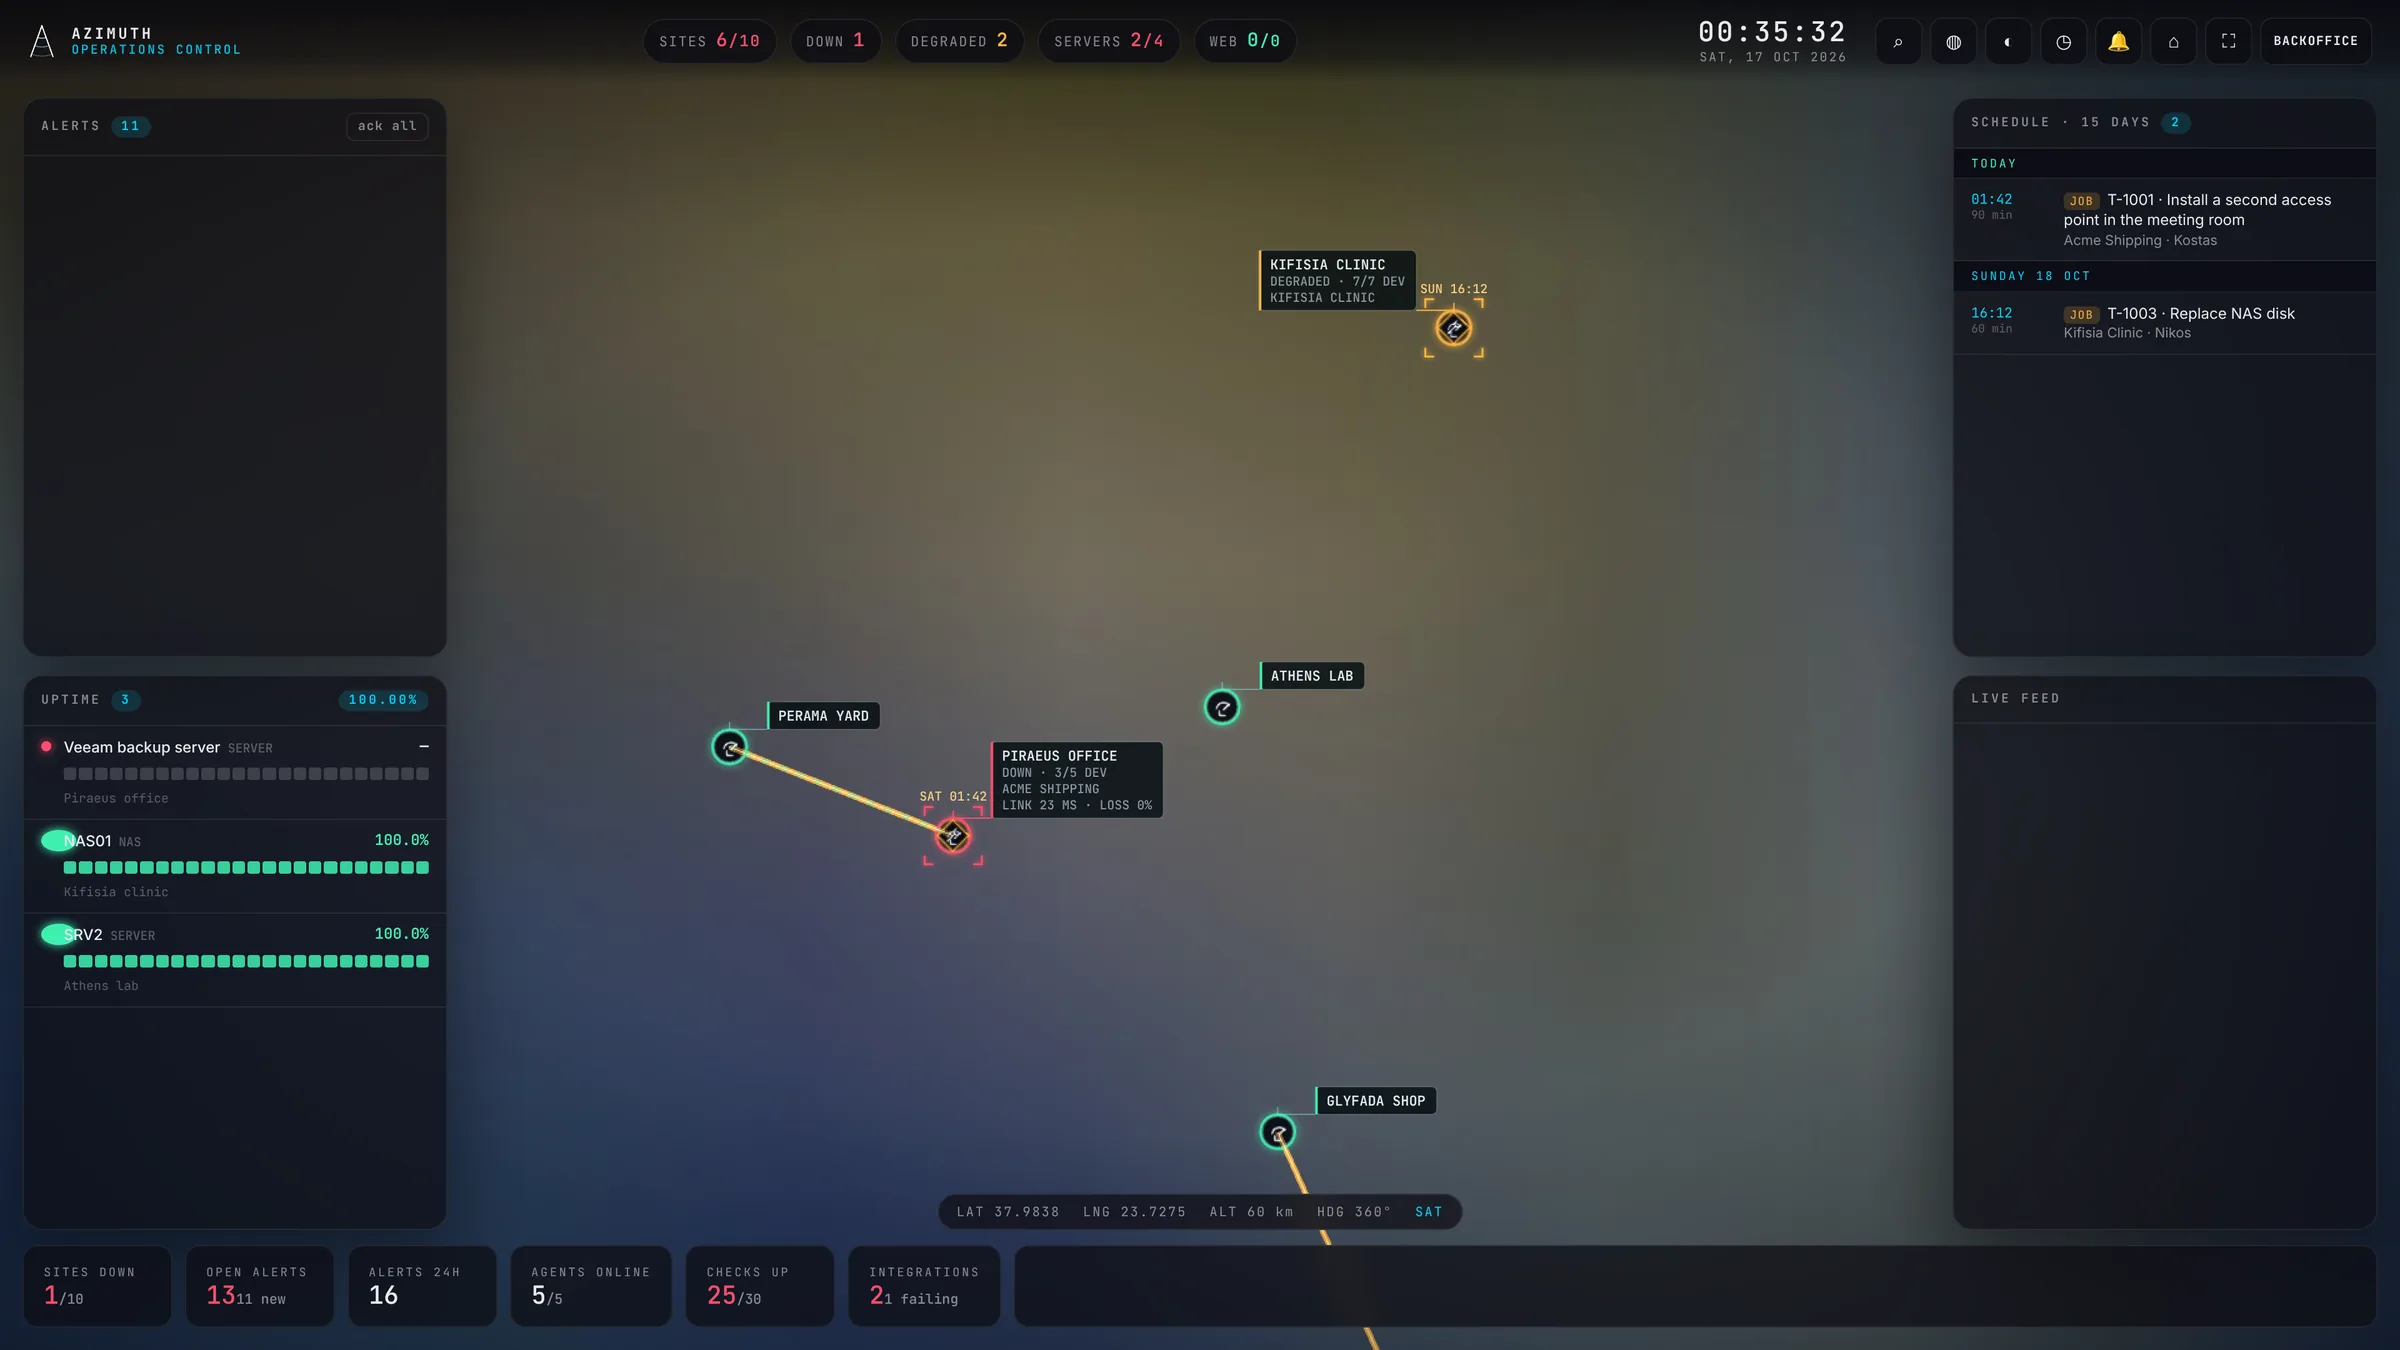
The globe in the real console.
In Azimuth the globe sits among your alerts, uptime, schedule and live feed. Put it on a TV as a wall screen: read-only, from a link you can revoke.
Last night, replayed.
One night across seven sites and a ship, the way the time scrubber in Azimuth lets you look back after an incident. Press play, drag the timeline or jump to any event. Watch how much happens without anyone being woken up.
Every site connected. No ports opened.
Each site connects to Azimuth over its own WireGuard tunnel. Sites behind CGNAT, Starlink or with overlapping addresses join as they are.
No renumbering
Customer networks keep their addresses, even when two sites use the same range.
Every link measured
VPNs, wireless bridges, fibre and leased lines, each against its own limits.
Backup is a warning
When a link fails over to its backup, you get a warning, not a midnight critical.
Maritime
Ships are sites too.
Watch the bridge PCs, the onboard network and the Starlink dish from the shore office, on the same globe, alerts and tickets as everything else. No open ports on board, no technician needed at sea.
- Starlink latency and uptime
- Onboard agent on every PC
- Ships beside your offices on the globe
See your own sites on Azimuth.
Tell us what you look after: offices, customers or ships. We'll set up a demo with your kind of equipment and send you a quote.